Mapping pet preferences in different geographical regions
Published:
![]()

With the availability of powerful ML models on sites like HuggingFace, it has become easy to utilize the power of machine learning for small personal projects that can be implemented in a few hours.
As an example, in this project, I wanted to see if a place has more cats or dogs by looking at the Google Street View images of that place. The images are obtained using the Google Street View API and the object detection is done using the DETR model on HuggingFace.
The code for this project is available in the Colab notebook linked at the top of this page. You can use the code to create a heatmap of any object in any geographical region after providing your own Street View API key.
Street View API
The Street View API is a part of the Google Maps Platform and can be used to get panoramic images of a place by providing the name of the place or its coordinates.
The APIHandler class in the notebook contains the code to get the images from the API and cache them locally to reduce the number of API calls.
class APIHandler:
    def __init__(self, api_url:str, metadata_url:str, api_key:str,
            signature:str=None, default_size:tuple[int, int]=(600, 400)
        ):
        self._api_url = api_url
        self._metadata_url = metadata_url
        self._api_key = api_key
        self._signature = signature
        self._default_size = default_size
        self._cache = {}

    def request_image(self, *, location:str=None, pano:str=None, size:tuple[int, int]=None, **kwargs):
        assert (location is None) + (pano is None) == 1, 'Exactly one of `location` or `pano` must be provided'
        size = self._default_size if size is None else size
        params = {
            'size' : f'{size[0]}x{size[1]}',
            'key' : self._api_key }
        if location is None:
            params['pano'] = pano
            cache_key = pano
        else:
            params['location'] = location
            cache_key = pano

        if cache_key in self._cache:
            img = self._cache[cache_key]
        else:
            if self._signature is not None:
                params['signature'] = self._signature
            r = requests.get(self._api_url, params=params|kwargs, stream=True)
            img = Image.open(r.raw)

        return img

    def request_metadata(self, location:str):
        params = {
            'location' : location,
            'key' : self._api_key }
        if self._signature is not None:
            params['signature'] = self._signature
        r = requests.get(self._metadata_url, params=params)
        return r.json()
Object Detection
We create an ObjectLocator class that uses the APIHandler to fetch the images and then perform object detection using the DETR-ResNet-50 model.
class ObjectLocator:
    def __init__(self, model, processor, api_handler):
        self._model = model
        self._processor = processor
        self._api_handler = api_handler

    ...
The maximum field of view of the camera is 120 degrees. So, to get a 360-degree view, we need to get 3 images from the same location with different headings and then stitch them together.
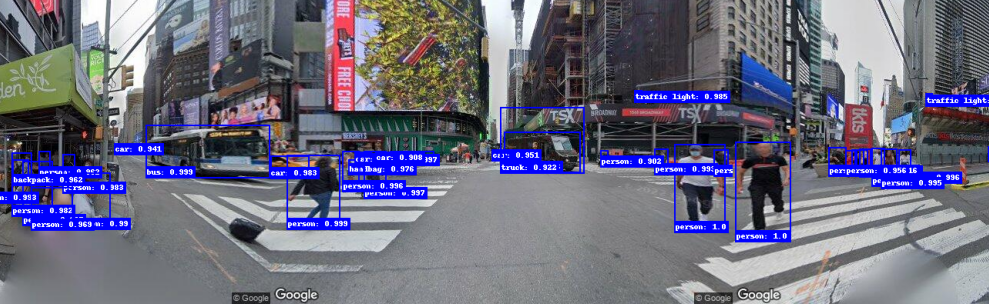
Once we have the full 360-degree panorama as a PIL.Image, we can use the DETR-ResNet-50 model from HuggingFace to detect the objects in the image and draw labeled bounding boxes around them.
class ObjectLocator:

    ...

    def _location_object_detection(self, pano:str, objects:list[str], *,
            threshold:float=0.9, show_image:bool=False):

        images_with_bb = []
        obj_bbs_requested_list = []
        for heading in [0, 120, 240]:
            image = self._api_handler.request_image(pano=pano, heading=heading, fov=120)
            obj_bbs = self._obj_detection(image, threshold=threshold)
            obj_bbs_requested = {}
            obj_bbs_other = {}

            for k, v in obj_bbs.items():
                if k in objects:
                    obj_bbs_requested[k] = v
                else:
                    obj_bbs_other[k] = v
            obj_bbs_requested_list.append(obj_bbs_requested)

            if show_image:
                image = self._draw_bounding_box(image, color='blue', **obj_bbs_other)
                image = self._draw_bounding_box(image, color='red', **obj_bbs_requested)
                images_with_bb.append(image)

        obj_bbs_requested = self._dict_add(obj_bbs_requested_list)

        if show_image:
            self._imshow(images_with_bb)

        return obj_bbs_requested

    ...
An example of a stitched image with bounding boxes is shown below.
Creating a heatmap
Now that we can detect objects for a given location, we can create a heatmap of any object by repeating the process for a grid of locations and then plotting the number of objects detected at each location.
class ObjectLocator:

    ...

    def heatmap(self, location:str, obj:str, *,
            dist:int=5,
            threshold:float=0.9,
            precision:float=0.5
        ):
        pano_ids = dict()
        results = dict()

        location_data = self._api_handler.request_metadata(location)
        lat, lon = location_data['location']['lat'], location_data['location']['lng']
        nearby_latlons = self._get_nearby_points(lat, lon, dist, precision)
        for lat, lon in nearby_latlons:
            loc_data = self._api_handler.request_metadata(f'{lat},{lon}')
            if 'pano_id' in loc_data:
                pano_ids[loc_data['pano_id']] = loc_data

        for pano, data in pano_ids.items():
            try:
                result = self._location_object_detection(pano, [obj], threshold=0.9)
                lat, lon = data['location']['lat'], data['location']['lng']
                results[(lat, lon)] = len(result.get(obj, []))
            except Exception:
                print(f'Warning: Could not add pano: {pano}')
                continue

        return results
We can also compare the relative popularity of two objects by plotting the difference in the number of objects detected for each location.
def hm_compare(hm1, hm2):
    hm = {}
    keys = set(hm1.keys()).intersection(set(hm2.keys()))
    for k in keys:
        hm[k] = hm1[k]-hm2[k]
    return hm
Results
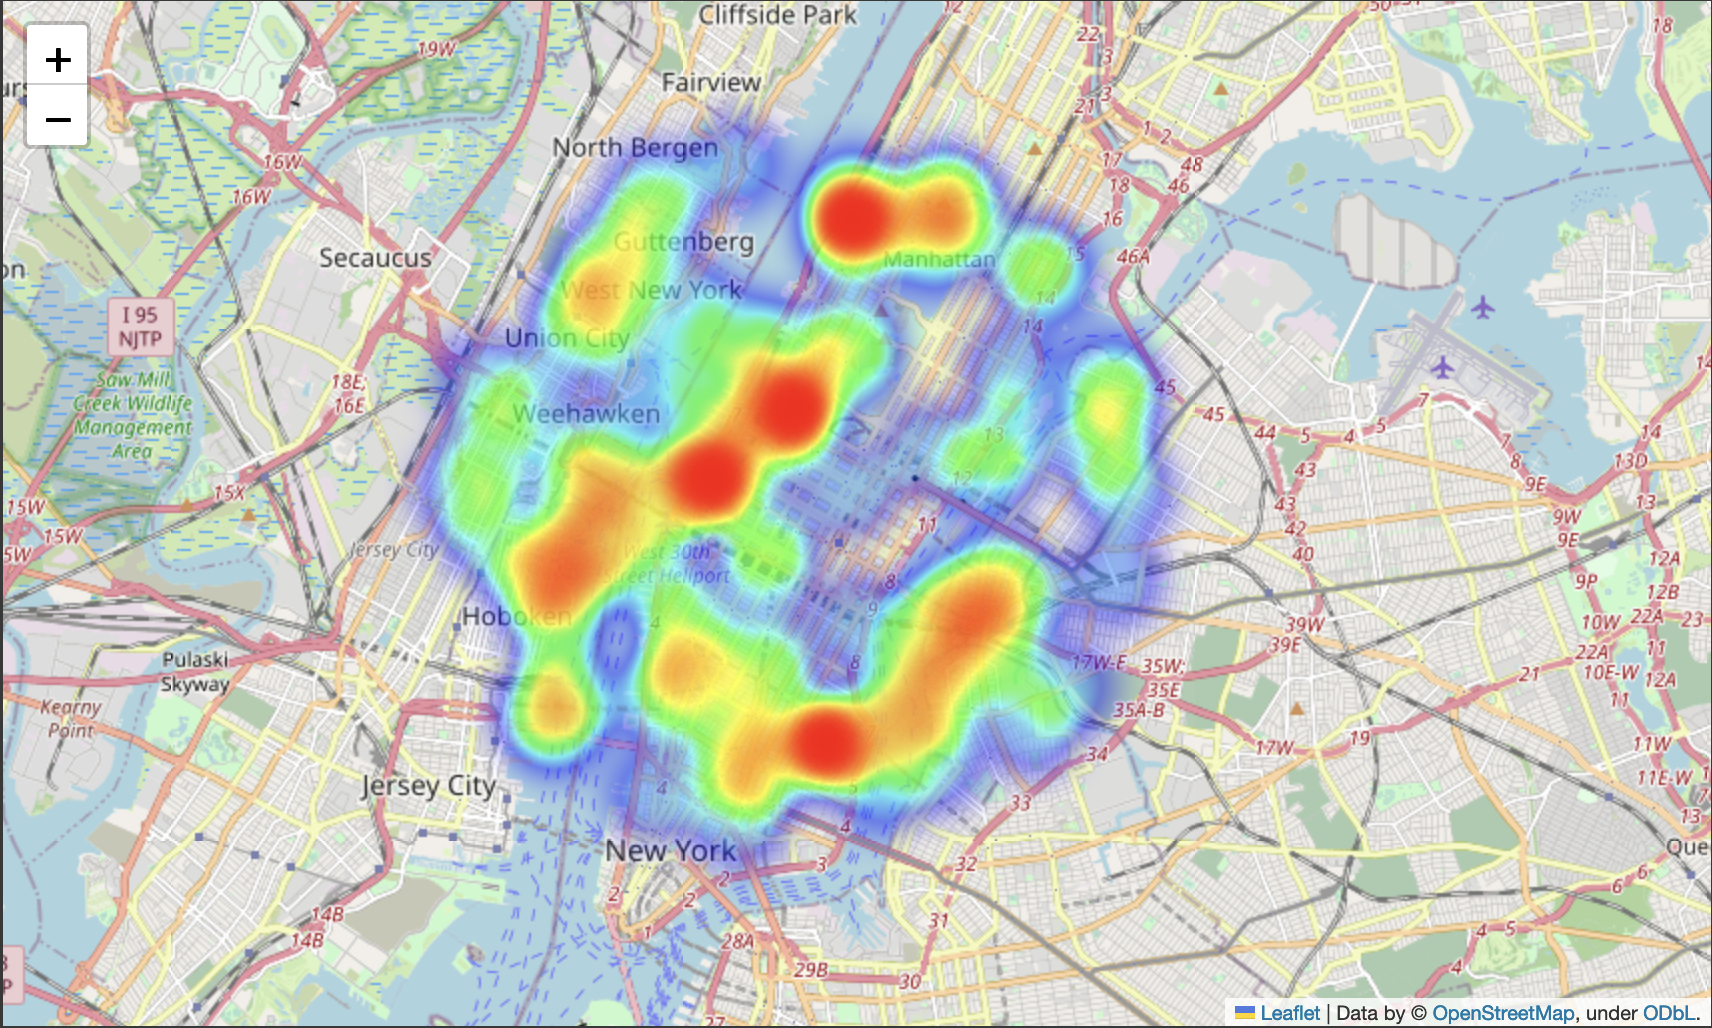
We can use Folium to plot this heatmap on a map of the region and get a visual representation of the number of objects detected at each location.
def create_heatmap(data):
    # Create a Folium map centered at a specific location
    map_center = list(data.keys())[0]  # Assuming the first key is a valid center
    heatmap_map = folium.Map(location=map_center, zoom_start=12)

    # Convert the data to a format suitable for HeatMap plugin
    heat_data = [(coord[0], coord[1], value) for coord, value in data.items()]

    # Add the heatmap layer to the map
    HeatMap(heat_data).add_to(heatmap_map)

    return heatmap_map
For example, if we want to know the locations where there are more dogs than cats around Times Square, we can plot the heatmap of the difference between the number of dogs and cats detected at each location.